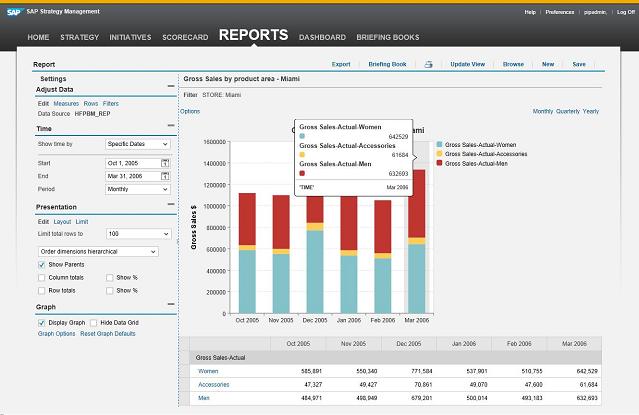
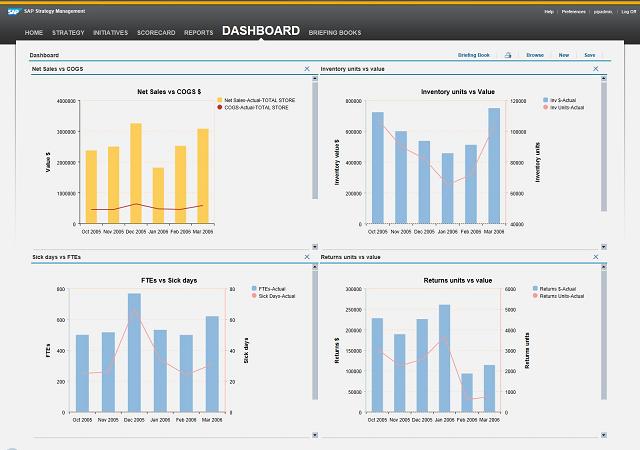
SAP Strategy Management’s Reports and Dashboards tabs enables users to analyse and visualise any of the underlying data for KPIs or their component metrics directly within the system and save and share these insights with colleagues. SAP Strategy Management provides these capabilities direct to the user without the need to involve IT.
An easy-to-use interface enables users of diverse functional backgrounds to quickly explore the data to highlight particular aspects either of performance or the underlying drivers of performance. Any of the KPI metrics or their underlying component metrics are available to be explored. For analysts seeking more depth to aid decision-making, SAP Strategy Management’s ad hoc analysis capabilities provide virtually boundless analysis options to measure and uncover the root of performance issues. Relevant views can then be gathered together in to Dashboards and saved.


Key features and benefits
- Simplified report views: Users can view reports based on specific areas of analysis for a more meaningful, in-depth measurement of performance and include a report description to provide other users with context about that report and the source of the information.
- Navigator ad hoc analysis: Helps analysts quickly understand the drivers of progress towards goals; slice and dice performance data any way they like and answer very specific, in-depth questions unique to their business.
- Reporting on performance versus previous periods: Enables examination of progress versus historical performance. View performance over specific dates (as defined by the user), relative dates (e.g. latest day, previous day, latest seven days, previous month, etc), latest date vs. previous equivalent (e.g. current month vs. same month last year, etc).
- Unique time templates: Enables users to perform custom time analyses without having to redefine their data set.
- Web-based Excel add-in capability: Gives access to the data in the underlying multi-dimensional OLAP database for more in-depth analysis of SAP Strategy Management’s performance data in Excel wherever users access the Web.
- Multiple-model dashboards: Information can be drawn from multiple sources, but displayed in a single dashboard.
Tel: +44 (0)870 166 2435, Fax: +44 (0)870 054 8795, Email: info@issel.co.uk
© 1996-2017 ISSEL Intranet Software Solutions (Europe) Ltd. All rights reserved
